The birth, evolution, and short history of Tesla deserves to be studied. Perhaps, the company’s repercussion is the tip of the iceberg of the change brought about in the entire automobile industry by the ‘Tesla phenomenon.’
The commitment of a startup to demonstrate to the world that the electric car can be beautiful, fast, safe, efficient, without harmful emissions for the environment and, at the same time, allow long trips in comfort has marked a before and after in the mobility that will characterize the first half of the XXI century.
This phenomenon’s repercussions have been rewarded in the stock markets that have catapulted Tesla to the top of the top, with a capitalization volume that produces figures that give real vertigo.
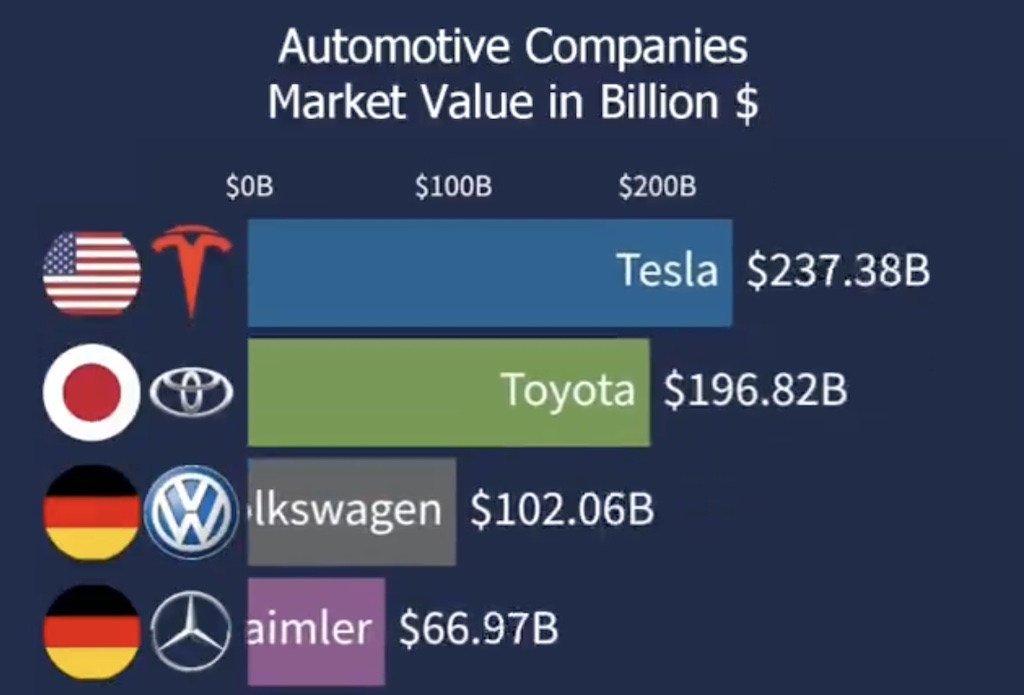
This week, the Owners Club of Mexico (@co_tesla) has published a graphical animation of Data In Action, which shows, in just over two minutes, the stock market evolution of the Top 10 of the automotive industry from 2006 to the present day.
If you haven’t seen this video yet, then check it out 🤯 @elonmusk pic.twitter.com/vWmXYkKXdk
— Tesla Owners Mexico 🇲🇽 (@co_tesla) December 11, 2020
During the animation, you can see how the largest industrial groups in the sector have evolved in the markets and the arrival of a small manufacturer of electric vehicles that, little by little, has been climbing positions until reaching the top.
Today, the Tesla (NASDAQ: TSLA) price is equivalent (according to the graph), approximately, to the sum of Toyota, VAG (Volkswagen), Daimler (Mercedes), General Motors, BMW, and Ferrari, which occupy the following six seats to the podium occupied by Elon Musk‘s company.

